Data science framework overview
This section outlines the steps in the data science framework and answers what is data mining. It ends with issues and important topics with data science.
Data Science is the art of turning data into actions and the overall framework is the following 7 high level steps:
Ask > Acquire > Assimilate > Analyze > Answer > Advise > Act
Asking Questions
Data science begins by asking questions, where the answers are then used to advise and act upon. A data scientist, like any good scientist, should not only have a formal mathematical background but the curiosity to ask and answer questions. Data should also be able to validate the answers to the questions and think critically if the assumptions made along the way are valid.
Acquiring and Assimilating Data
Once a series of questions are asked, a data scientist will try and acquire the required data and assimilate in a form which is usable. It is a data scientist’s role to determine which inputs or features will enable the data mining, pattern recognition and machine algorithms to work. Determining the features is a process called Feature Engineering. Once the features are determined, the data acquisition could be simple as downloading the data from an open data source or creating an collaborate framework to log or measure data. Once the data is collected, it needs to cleaned and transformed. This step usually involves dealing with missing values, incorrect values and potential outliers.
What form does data come in?
There are many different types of data and data can come in various forms. Structured data is usually in the form of discrete or categorical variables (finite set of possible values such as gender) or continuous or numeric variables which are integers or real numbers (for example temperature, salary, credit score etc.). A special case of categorical variables are boolean or binary variables which are yes/no or true/false.
We can ofter convert numeric to discrete by binning (for example hot/medium/cold for temperature). This is because some algorithms work well with categorical variables or can not handle numeric variables or we would like to purposely anonymize the data. Categorical variables can be converted numeric through encoding.
While the analysis of the data may seem to be the most important step, data collection, data cleaning and feature engineering are usually the most most expensive and difficult. Have poor data but solid modeling will not ensure good results. There is the Garbage In, Garbage Out concept in computer science and information theory that since computers operate by logical processes, will unquestioningly process unintended, even nonsensical, input data (“garbage in”) and produce undesired, often nonsensical, output (“garbage out”).
Analyzing Data
Once the data has been collected and cleaned, we are now ready to start the analysis or conduct data mining.
What is data mining?
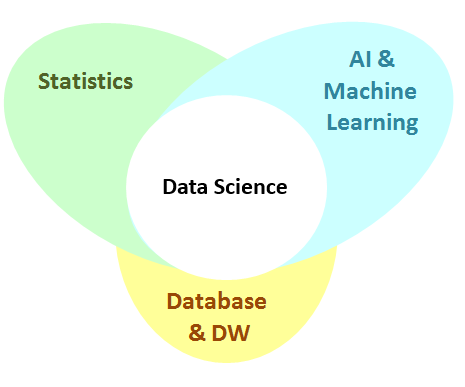
Data mining (sometimes called knowledge discovery in data) is extracting implicit and potentially useful information from data. Dr. Saed Sayad says is best “data mining is about explaining the past and predicting the future by means of data analysis”. This is done by finding patterns and structure in data and summarizing it into useful information which can be used for decision making. It is the union of statistics, artificial intelligence & machine learning and databases.
What is not data mining? SELECT FROM WHERE queries, looking up a telephone number in the phone book, searching the web (information retrieval not data mining) Some can think of data mining as applied machine learning or pattern recognition. On the home page of this guide you will friend a tree or road map to the larger study of data science, this is a high level data mining road map:
The outline has the links to the in depth explanation for each the topics, the rest of this section will provide a high level outline for each of the data mining topics.
What is Exploratory Data Analysis and Summary Statistics?
Summary statistics are basic measures which are used to summarize data, and exploratory data analysis (EDA) is the process of using summary statistics and visualization techniques to describe the data. Exploratory data analysis is a very important step in understanding the data before building any models or many any decisions. By understanding and representing the data, a data scientist is able to make informed decisions on how to analyze the data and validate assumptions about the data. The tutorials outline examples of why EDA is very important before building any model. The section of this guide outlines examples of all of these.
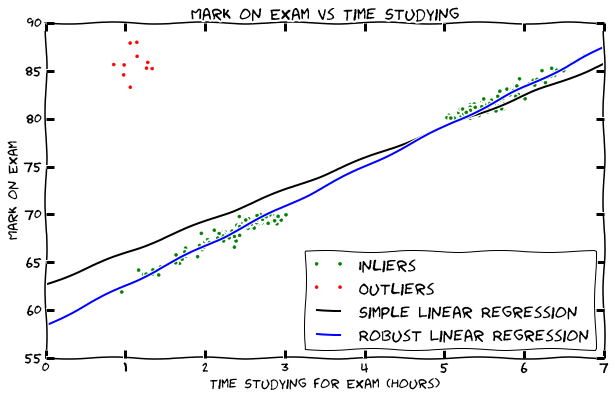
A very simple example of of exploratory data analysis is a scatter plot of the grades of a exam vs the amount of time students said they studied.
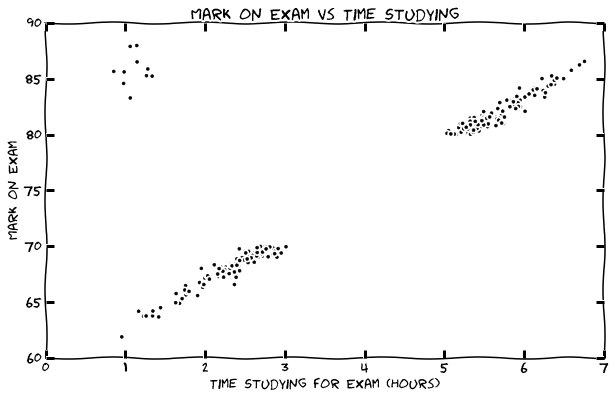
We will continue to use this example dataset (where possible) in this article to explain the basic types of analysis.
What is Association?
If you have an item-sets such a products purchased together or words in a document, you can determine which items are related (and the strength of the relation). An example is a database with supermarket transaction, a common association could be that bread is associated with butter.

Association is important as it can be used for product placement, indirectly boost the sale volume of one product by lower the price of another, and determine which products would be affect if a specific production is removed from being sold.
What is Clustering?
Clustering is a method to segment data into natural groupings. It is called an unsupervised method since the data is not labeled and the natural groups are not known. The algorithm is able to organize the data and determine clusters and cluster centers.
 Image from here
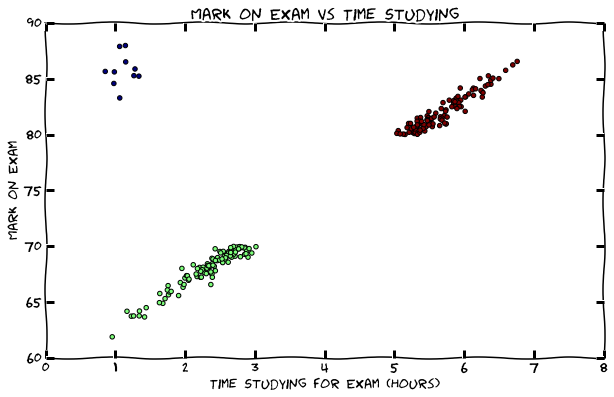
An example of this clustering a class based on the grade and the hours of study. In an average class there will be students who do not study for long and get low grades (let us call them slackers), students who study for long and get high grades (let us call them keeners) and students who get high grades but do not study for long (let us call them geniuses or liars). The slackers, keeners and geniuses are show in green, red, and blue in the figure below:
What is Regression?
Regression is fitting a line (y = mx+b) or a curve to a set of data to conduct numeric prediction. Regression can also be used to do predictive causality analysis, meaning determining the strength of the correlation of two features. Back to the example of class grades, a line can be fit against the number of hours of study and the grade. In this course, we will learn how to do robust regression and deal with the outliers as shown in the the figure below:
What is outlier detection?
An outlier is a data point or set of data points which deviates so much from the other observations what there is possibility that it could be generated by a different mechanism. Outlier detection are a set of methods to determine such observations. This means that it can be used to find a problem with the data (garbage) or provide an interesting observation (treasure). Back to our example of students grades, students with high grades who study very little are outliers. This could be because these students had a prior experience with the subject, could be geniuses or the real reason might be because they wrote an incorrect amount of studying or grade if a survey was used to collect the data. There are many techniques to determine outliers, but two popular methods are using clustering or using the residual error (difference of observation vs prediction) from regression as shown in the figures above.
What is Classification?
Given a set of inputs or features and a labeled discrete class variable or attribute, classification determines which class or label it belongs to for new data. This is done by determining a set of rules based on the past data. Rules can be generated using many techniques and even combination of techniques where each has their advantages and disadvantages. The model is tested by a subset of the labeled data which the algorithm has not used to generate the rules. An example of a method for classification is using a decision tree which can use information entropy to determine rules. An example of a decision tree for the marks and hours study example is the following:
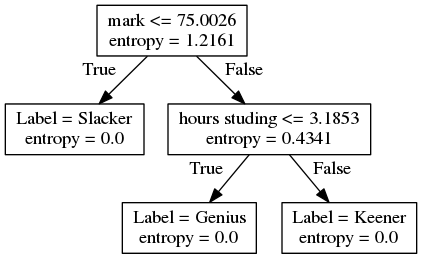
We can now predict if a person is a slacker, a keener or a genius given the grade on the exam and their hours studied. By following the tree, if we know the person has a grade less than 75% then they the would be a labeled as a Slacker. If not, and they had studied less than about 3 hours, then they are labeled as a Genius, otherwise they are labeled as a Keener.
Answering Questions with data
While the example of grade vs time studying is very intuitive and simple, examples with real data is very messy. Since there are many features (inputs) and the data has variance, it is expected that the model will have some irreducible error, and also suffer from bias and variance. Therefore after we are able to build a model with the data, we need to evaluate if the model is performing well, and then tune the model, choose another model or combine model until we have the desired performance. We will be then able to answer the question with data with a proper model. We must also always remember than since data is collected, it is not always the truth and the correlations found in the data, does not always mean causation, since there are many factors involved. This whole process from the exploratory data, to modeling and evaluation (for the purposes of the course) is called data mining, and we will learn the details of all the mentioned topics in this guide.
Advise and Act
Another very important (and often forgotten) part of data science is the Advise stage. After understanding data, a data scientist will have to provide actionable advise. This is done through optimization, simulation, project economics, and decision making under uncertainty. The guide will focus on data mining for now, but the Advise section will come soon!
Now that we understand the overall data science framework, we can move onto learn about feature engineering.